
Estate planning data & research
Put a care quote beside a transparent income benchmark. Compare all 50 states and DC, then try your own scenario. This resource uses the income of households with a householder age 65+, not a prediction of what any individual family can afford.
U.S. median annual income for older-householder households
Estimate uncertainty for that median
Illustrative $60,000 annual bill / median income
The table assumes $5,000 per month in 2024 dollars ($60,000 yearly) to make the same arithmetic comparable across states. It is not the cost of a nursing home, home care or assisted living in a particular place. Replace it with a quote in the calculator.
What “older-household income” means
The Census category is a household whose householder is age 65 or older. Other household members may be younger. The figure measures annual household money income before taxes, not one person’s Social Security check, disposable income, savings or home equity. A state median describes the middle of this household distribution; it is not a sum of resources available to each family.
The ACS period is 2020–2024 and values are adjusted to 2024 dollars. A quote from another year is a historical nominal comparison unless you also convert its dollar year. The calculator does not silently adjust inflation. Enter current personal income if that is the more relevant denominator, while keeping tax and living-expense differences in mind.
Try a care-cost scenario
Default is an illustrative $5,000 monthly in 2024 dollars. Your inputs stay in this browser; no calculator input tracking is added.
All state income benchmarks
“Monthly income equivalent” divides the annual median by twelve; it is not money left over after taxes and living expenses. The scenario percentage uses the same $60,000 annual illustration in every row. Changing the calculator does not change this fixed-benchmark table.
| State | Median older-household income | Estimate uncertainty | Monthly income equivalent | Illustrative $60,000 bill / income |
|---|---|---|---|---|
| Alabama | $49,014 | ±$505 | $4,084 | 122.4% |
| Alaska | $71,650 | ±$3,060 | $5,971 | 83.7% |
| Arizona | $61,054 | ±$580 | $5,088 | 98.3% |
| Arkansas | $45,887 | ±$763 | $3,824 | 130.8% |
| California | $71,089 | ±$342 | $5,924 | 84.4% |
| Colorado | $67,371 | ±$897 | $5,614 | 89.1% |
| Connecticut | $69,492 | ±$994 | $5,791 | 86.3% |
| Delaware | $68,198 | ±$1,386 | $5,683 | 88.0% |
| District of Columbia | $70,184 | ±$2,976 | $5,849 | 85.5% |
| Florida | $57,397 | ±$339 | $4,783 | 104.5% |
| Georgia | $55,022 | ±$557 | $4,585 | 109.0% |
| Hawaii | $87,344 | ±$2,031 | $7,279 | 68.7% |
| Idaho | $58,461 | ±$907 | $4,872 | 102.6% |
| Illinois | $59,361 | ±$456 | $4,947 | 101.1% |
| Indiana | $52,461 | ±$511 | $4,372 | 114.4% |
| Iowa | $55,083 | ±$716 | $4,590 | 108.9% |
| Kansas | $56,822 | ±$631 | $4,735 | 105.6% |
| Kentucky | $46,908 | ±$530 | $3,909 | 127.9% |
| Louisiana | $46,093 | ±$589 | $3,841 | 130.2% |
| Maine | $54,559 | ±$1,061 | $4,547 | 110.0% |
| Maryland | $74,992 | ±$846 | $6,249 | 80.0% |
| Massachusetts | $66,336 | ±$676 | $5,528 | 90.4% |
| Michigan | $55,014 | ±$386 | $4,584 | 109.1% |
| Minnesota | $60,491 | ±$495 | $5,041 | 99.2% |
| Mississippi | $43,306 | ±$772 | $3,609 | 138.5% |
| Missouri | $52,285 | ±$443 | $4,357 | 114.8% |
| Montana | $55,214 | ±$1,236 | $4,601 | 108.7% |
| Nebraska | $56,015 | ±$831 | $4,668 | 107.1% |
| Nevada | $60,766 | ±$779 | $5,064 | 98.7% |
| New Hampshire | $65,689 | ±$1,202 | $5,474 | 91.3% |
| New Jersey | $70,763 | ±$574 | $5,897 | 84.8% |
| New Mexico | $53,098 | ±$1,031 | $4,425 | 113.0% |
| New York | $59,616 | ±$419 | $4,968 | 100.6% |
| North Carolina | $53,003 | ±$458 | $4,417 | 113.2% |
| North Dakota | $55,526 | ±$1,599 | $4,627 | 108.1% |
| Ohio | $52,515 | ±$343 | $4,376 | 114.3% |
| Oklahoma | $53,058 | ±$609 | $4,422 | 113.1% |
| Oregon | $61,155 | ±$749 | $5,096 | 98.1% |
| Pennsylvania | $54,867 | ±$428 | $4,572 | 109.4% |
| Rhode Island | $61,049 | ±$2,087 | $5,087 | 98.3% |
| South Carolina | $53,541 | ±$649 | $4,462 | 112.1% |
| South Dakota | $55,181 | ±$1,281 | $4,598 | 108.7% |
| Tennessee | $51,886 | ±$527 | $4,324 | 115.6% |
| Texas | $56,912 | ±$318 | $4,743 | 105.4% |
| Utah | $69,005 | ±$1,081 | $5,750 | 87.0% |
| Vermont | $58,664 | ±$1,534 | $4,889 | 102.3% |
| Virginia | $66,103 | ±$624 | $5,509 | 90.8% |
| Washington | $67,096 | ±$606 | $5,591 | 89.4% |
| West Virginia | $45,766 | ±$898 | $3,814 | 131.1% |
| Wisconsin | $56,488 | ±$404 | $4,707 | 106.2% |
| Wyoming | $58,468 | ±$1,653 | $4,872 | 102.6% |
How to read a percentage above 100%
It means the illustrative annual bill is larger than the median annual household income benchmark. It does not establish that a stated percentage of families cannot pay. Families differ in assets, household income, benefits, insurance, care duration, assistance and other expenses. Income below the median also does not establish eligibility for a government program.
The comparison is most useful for asking what a quote includes and what other financial information must be gathered. Different settings charge differently: home care may depend on hours and minimum shifts; a residential quote may include a room but exclude additional services. This calculator accepts a monthly bill; it does not predict which setting fits a person or which insurer will pay.
A reusable comparison chart
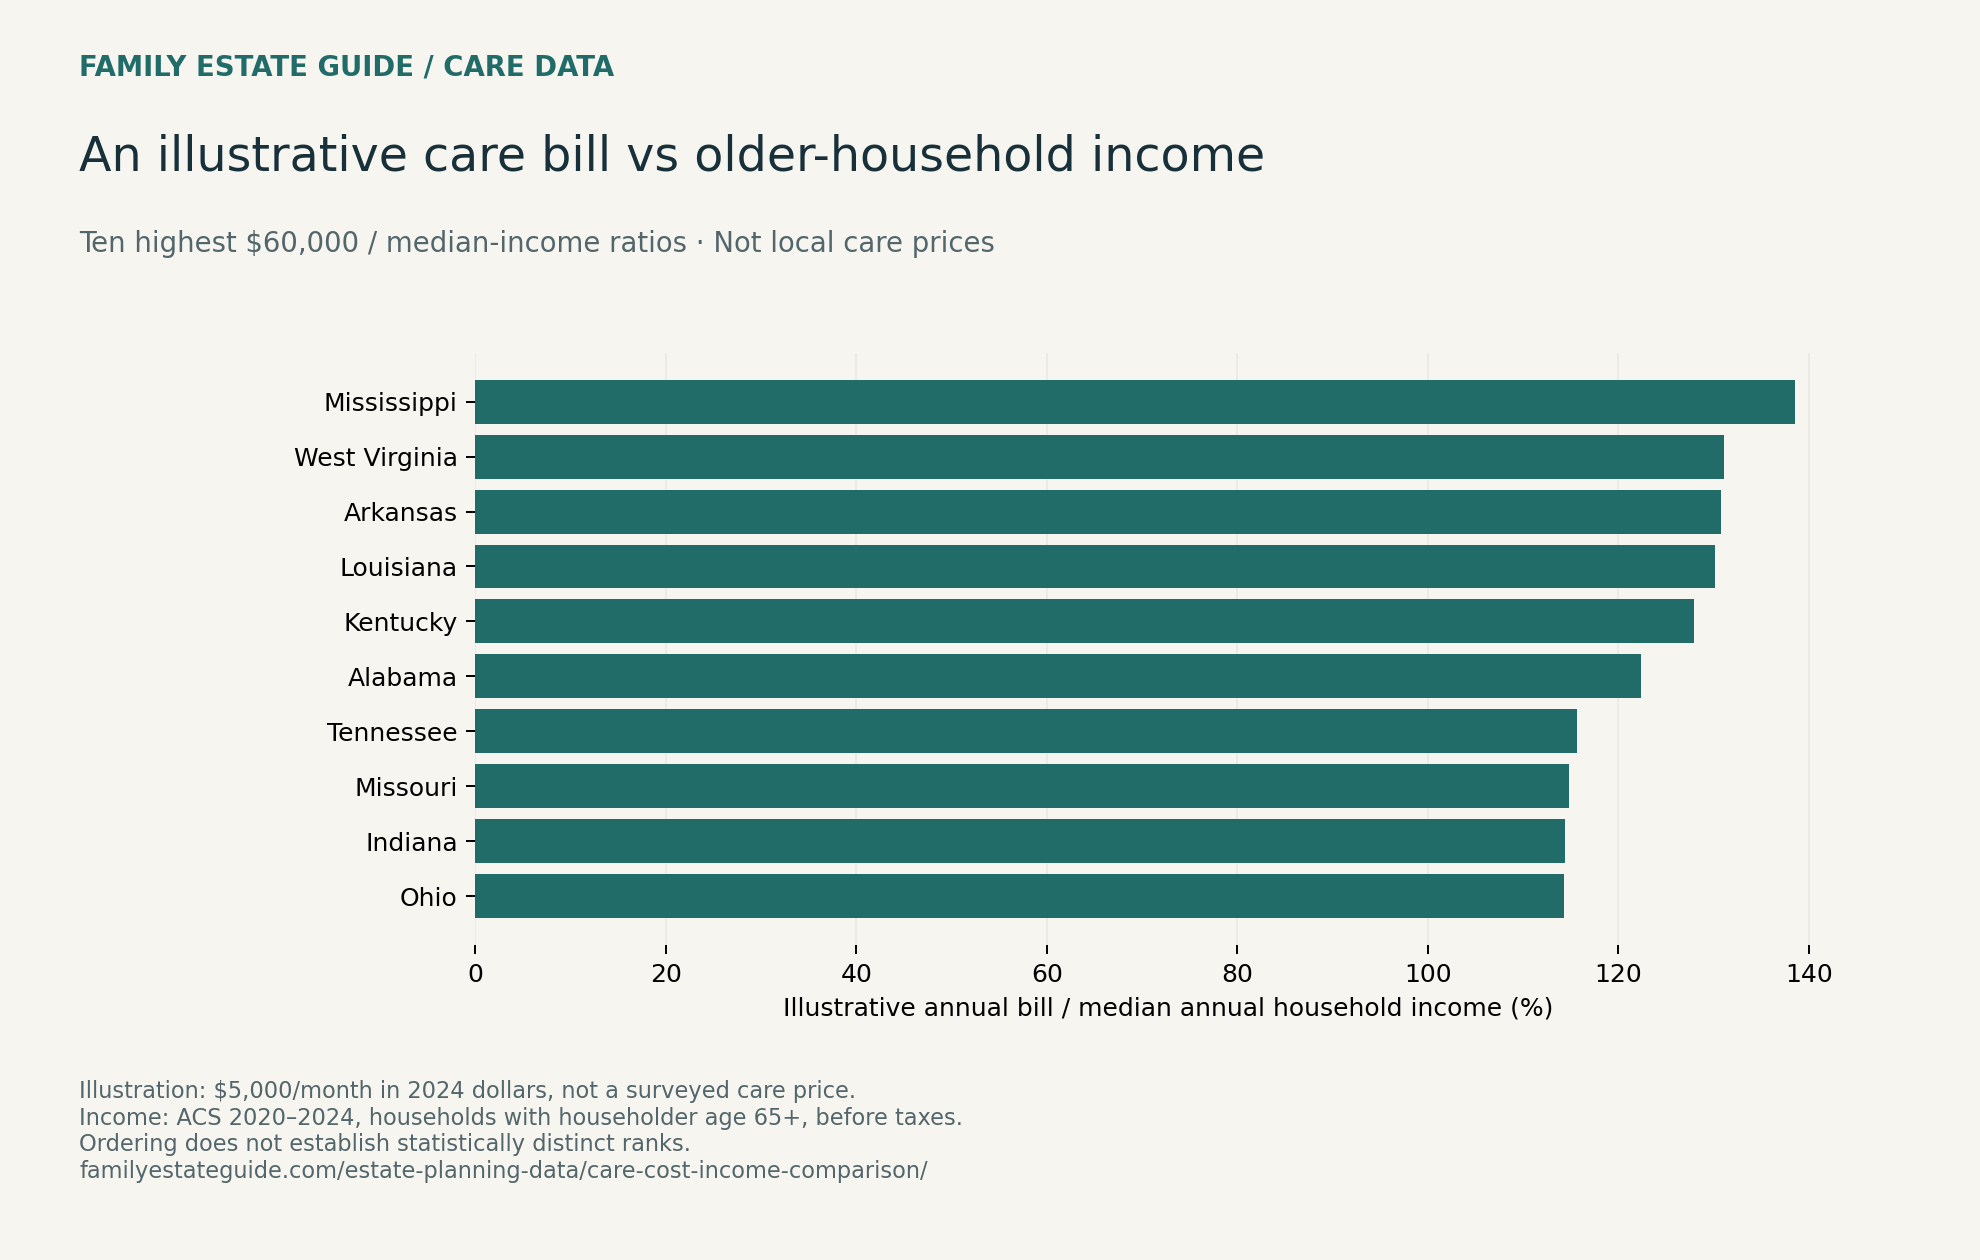
The chart shows ten highest illustrative-bill-to-income point-estimate ratios. It does not rank actual state care prices or establish distinct statistical ranks.
Gather the facts before treating a quote as a budget
- Ask for the base monthly charge and all additional service fees.
- Keep the cost year and income year clear, especially when using historical benchmarks.
- Separate recurring income from savings and other assets.
- Check the person’s payment and support arrangements through the relevant official program or adviser.
See the nursing-home costs and quality reference for source-specific prices, or our certified nursing-home capacity comparison for facility and population context. Neither resource determines current admissions availability.
Keep document planning in its own budget
Care expenses do not tell you whether someone needs a will or trust. Use the essential documents guide to organize financial and healthcare authority, and the aging-parent roadmap to plan the conversation. If you are separately evaluating a trust, the living-trust cost guide explains document/service budgeting questions. A care-cost ratio is not a reason to buy a particular package.
Sources, methodology and reuse
Where do these figures come from?
CMS Provider Information describes active certified facilities. Processing date: 2026-08-01; source retrieved September 17, 2026. Population and household income use Census ACS 2020–2024 five-year estimates, including all 50 states and DC. Territories are excluded. These source periods differ; this is not a same-day census.
ACS B01001 age estimates · ACS B19049 household income · Census income definitions.
Calculations, missing values and estimate uncertainty
Providers are deduplicated by CMS Certification Number. Known certified beds are summed by state; missing counts are reported separately. Beds per 1,000 divide known beds by the stated age-group estimate and multiply by 1,000. Those certified beds serve all ages; the denominator is a comparison benchmark, not an allocation of beds to older residents. Facility star percentages use rated facilities only and give each facility equal weight.
The income median is for households with a householder age 65+, before taxes, in 2024-adjusted dollars. It is not disposable income, personal retirement income or wealth. The ± value shows sampling uncertainty at Census’s standard 90% confidence level. Wider intervals mean less precise estimates. No statistically distinct state ranking or individual affordability conclusion is established.
Complete formulas, variable definitions and limitations (TXT).
Download all 51 state/DC rows (CSV) · Analysis, charts, SVGs and methodology (ZIP)
Published September 17, 2026. Educational comparison, not an individual affordability or program-eligibility determination. Editorial standards.