
U.S. county atlas · Research index
A community-focused report for Florida families, local reporters and aging organizations. Explore all 67 counties, with Census source periods, margins of error and reusable evidence.
What does ± mean? These survey figures are estimates. The ± value shows their sampling uncertainty: for example, 30.8% ±0.6 percentage points gives a range of 30.2%–31.4%. A wider range means a less precise estimate. How the confidence level works.
Florida’s statewide picture
Florida’s estimated count and share of older adults living alone both increased between the two survey periods. That is a different demographic description from California’s, but this page serves Florida communities on their own terms. It does not establish that a particular household arrangement is a problem or identify why the change occurred.
Older residents living alone
2020–2024 ACS estimate; count uncertainty ±10,197.
Share of all residents age 65+
estimate uncertainty ±0.20 percentage points.
The earlier 2015–2019 estimate was 997,955 older residents living alone, or 23.7% of older residents. The count rose 15.9%; the share changed by +0.47 percentage points (change uncertainty ±0.25 pp). The statewide share difference exceeds that unadjusted change margin.
The older-resident denominator rose 13.7% to 4,781,978. That arithmetic helps explain how count growth and share change relate; it does not identify the social causes of either pattern. The U.S. point-estimate share is 26.6%. Florida’s point estimate is 2.4 percentage points lower, but this report does not test a state-versus-national difference.
Local findings worth examining
Pinellas: a large-county high-share example
Pinellas combines a substantial estimated living-alone count with a relatively high point-estimate share. That makes it a useful county for local reporting without relying on a very small sample county. The table still includes its survey uncertainty; being large does not remove uncertainty.
The 2020–2024 estimate is 78,288 residents age 65+ living alone (count uncertainty ±1,900), representing 30.8% of all older residents (share margin ±0.64 percentage points).
The share change from 2015–2019 is +0.70 pp, with an change uncertainty ±0.81 pp. The change is not established after correction across the national family of 3,133 comparable county tests. Explore this county and its source table.
Palm Beach: a count-focused community story
Palm Beach illustrates the scale of older households living alone in a populous county. Its count is useful for describing how many residents the estimate represents, while the share puts that figure alongside all older county residents. Neither measure identifies how many people need assistance.
The 2020–2024 estimate is 101,970 residents age 65+ living alone (count uncertainty ±2,221), representing 26.8% of all older residents (share margin ±0.49 percentage points).
The share change from 2015–2019 is -0.15 pp, with an change uncertainty ±0.64 pp. The change is not established after correction across the national family of 3,133 comparable county tests. Explore this county and its source table.
Miami-Dade: do not generalize one Florida county to another
Miami-Dade’s point-estimate share is below the Florida state figure, despite a substantial count. That contrast shows why a single statewide percentage does not describe every local community. The analysis does not test all county-versus-state differences, and it cannot establish why household patterns vary.
The 2020–2024 estimate is 100,084 residents age 65+ living alone (count uncertainty ±2,610), representing 21.6% of all older residents (share margin ±0.51 percentage points).
The share change from 2015–2019 is +1.30 pp, with an change uncertainty ±0.64 pp. The change is supported after correction across the national family of 3,133 comparable county tests. Explore this county and its source table.
Marion: separate an apparent increase from a supported change
Marion offers a local example for examining changes between survey periods. The county-specific change margin and nationally adjusted comparison label should accompany the change. Reporter questions about migration, housing or support services require additional sources; this atlas does not assign a cause.
The 2020–2024 estimate is 28,823 residents age 65+ living alone (count uncertainty ±1,361), representing 25.1% of all older residents (share margin ±1.05 percentage points).
The share change from 2015–2019 is +2.66 pp, with an change uncertainty ±1.37 pp. The change is supported after correction across the national family of 3,133 comparable county tests. Explore this county and its source table.
All Florida counties
This table includes all 67 counties, rather than only a ranked shortlist. Share-change labels use the nationwide multiple-comparison procedure, not a separate set of tests selected for Florida. Counts and shares are point estimates. Sorting by share does not establish statistically distinct ranks.
Open the interactive Florida county map · Download all Florida counties (CSV)
| County / equivalent | State | Age 65+ living alone | Share | estimate uncertainty | Share change |
|---|---|---|---|---|---|
| Palm Beach County | Florida | 101,970±2,221 | 26.8% | ±0.49 pp | -0.15 ppNot established |
| Miami-Dade County | Florida | 100,084±2,610 | 21.6% | ±0.51 pp | +1.30 ppSupported change |
| Broward County | Florida | 94,210±2,346 | 26.6% | ±0.57 pp | +0.26 ppNot established |
| Pinellas County | Florida | 78,288±1,900 | 30.8% | ±0.64 pp | +0.70 ppNot established |
| Hillsborough County | Florida | 53,928±1,469 | 23.5% | ±0.54 pp | -1.17 ppNot established |
| Lee County | Florida | 50,703±1,804 | 21.4% | ±0.70 pp | +0.97 ppNot established |
| Duval County | Florida | 42,927±1,428 | 27.4% | ±0.78 pp | -0.58 ppNot established |
| Sarasota County | Florida | 41,089±1,444 | 23.8% | ±0.74 pp | -0.31 ppNot established |
| Brevard County | Florida | 39,319±1,347 | 25.4% | ±0.75 pp | -0.34 ppNot established |
| Orange County | Florida | 39,064±1,800 | 20.4% | ±0.87 pp | -0.21 ppNot established |
| Volusia County | Florida | 37,964±1,449 | 25.8% | ±0.87 pp | -0.21 ppNot established |
| Polk County | Florida | 36,450±1,585 | 23.6% | ±0.94 pp | +2.14 ppSupported change |
| Pasco County | Florida | 34,850±1,489 | 26.0% | ±1.00 pp | +1.21 ppNot established |
| Manatee County | Florida | 29,963±1,406 | 24.5% | ±1.04 pp | +1.93 ppNot established |
| Collier County | Florida | 29,125±1,469 | 21.6% | ±0.99 pp | +2.28 ppSupported change |
| Marion County | Florida | 28,823±1,361 | 25.1% | ±1.05 pp | +2.66 ppSupported change |
| Lake County | Florida | 24,154±1,154 | 22.0% | ±0.94 pp | -0.51 ppNot established |
| St. Lucie County | Florida | 19,331±1,272 | 21.8% | ±1.29 pp | +1.29 ppNot established |
| Seminole County | Florida | 18,510±1,085 | 23.1% | ±1.24 pp | +0.48 ppNot established |
| Charlotte County | Florida | 17,317±1,105 | 21.2% | ±1.26 pp | -0.17 ppNot established |
| Sumter County | Florida | 16,756±1,376 | 20.3% | ±1.57 pp | +2.02 ppNot established |
| Escambia County | Florida | 15,693±912 | 26.9% | ±1.39 pp | +0.51 ppNot established |
| Citrus County | Florida | 14,788±840 | 24.9% | ±1.24 pp | +2.15 ppNot established |
| Indian River County | Florida | 14,203±863 | 24.4% | ±1.33 pp | +0.99 ppNot established |
| Martin County | Florida | 13,092±739 | 25.1% | ±1.21 pp | -1.25 ppNot established |
| Hernando County | Florida | 12,991±789 | 23.8% | ±1.30 pp | +1.24 ppNot established |
| Alachua County | Florida | 12,890±849 | 29.5% | ±1.68 pp | +1.81 ppNot established |
| St. Johns County | Florida | 12,693±834 | 19.6% | ±1.16 pp | -0.71 ppNot established |
| Leon County | Florida | 12,493±635 | 28.4% | ±1.22 pp | +0.04 ppNot established |
| Osceola County | Florida | 10,162±938 | 17.7% | ±1.52 pp | +1.93 ppNot established |
| Highlands County | Florida | 9,379±775 | 24.6% | ±1.86 pp | +3.42 ppNot established |
| Bay County | Florida | 8,684±622 | 25.5% | ±1.59 pp | -1.17 ppNot established |
| Okaloosa County | Florida | 8,137±565 | 22.6% | ±1.39 pp | -4.99 ppSupported change |
| Flagler County | Florida | 7,814±699 | 19.7% | ±1.63 pp | +0.49 ppNot established |
| Clay County | Florida | 7,341±638 | 18.8% | ±1.47 pp | -2.05 ppNot established |
| Santa Rosa County | Florida | 6,887±680 | 20.7% | ±1.87 pp | +0.13 ppNot established |
| Nassau County | Florida | 5,054±547 | 21.6% | ±2.14 pp | +3.07 ppNot established |
| Putnam County | Florida | 5,054±511 | 28.3% | ±2.47 pp | -1.05 ppNot established |
| Monroe County | Florida | 4,906±520 | 24.2% | ±2.31 pp | -0.54 ppNot established |
| Walton County | Florida | 3,760±508 | 22.6% | ±2.85 pp | -3.21 ppNot established |
| Columbia County | Florida | 3,424±424 | 23.5% | ±2.63 pp | +0.50 ppNot established |
| Levy County | Florida | 3,257±403 | 28.6% | ±3.15 pp | +2.41 ppNot established |
| Jackson County | Florida | 2,962±329 | 29.4% | ±2.81 pp | +0.12 ppNot established |
| Okeechobee County | Florida | 2,321±320 | 28.4% | ±3.42 pp | +6.67 ppNot established |
| Suwannee County | Florida | 2,231±384 | 23.2% | ±3.67 pp | +5.10 ppNot established |
| Gadsden County | Florida | 2,199±295 | 25.3% | ±2.89 pp | -4.99 ppNot established |
| DeSoto County | Florida | 1,688±329 | 20.1% | ±3.59 pp | +0.38 ppNot established |
| Bradford County | Florida | 1,523±250 | 30.1% | ±4.15 pp | +6.36 ppNot established |
| Holmes County | Florida | 1,316±205 | 31.8% | ±4.02 pp | +3.87 ppNot established |
| Wakulla County | Florida | 1,287±286 | 22.0% | ±4.56 pp | -4.65 ppNot established |
| Taylor County | Florida | 1,269±254 | 27.8% | ±4.89 pp | +3.18 ppNot established |
| Washington County | Florida | 1,193±181 | 24.8% | ±3.26 pp | -2.79 ppNot established |
| Hendry County | Florida | 1,169±324 | 20.0% | ±5.07 pp | +0.05 ppNot established |
| Madison County | Florida | 1,133±189 | 27.3% | ±3.85 pp | -3.33 ppNot established |
| Dixie County | Florida | 1,109±223 | 27.2% | ±4.89 pp | +3.53 ppNot established |
| Baker County | Florida | 1,018±281 | 23.5% | ±5.92 pp | +0.66 ppNot established |
| Jefferson County | Florida | 875±167 | 23.7% | ±3.95 pp | +0.20 ppNot established |
| Gilchrist County | Florida | 864±176 | 22.4% | ±4.06 pp | +0.69 ppNot established |
| Gulf County | Florida | 840±180 | 23.4% | ±4.41 pp | +0.47 ppNot established |
| Franklin County | Florida | 771±156 | 23.2% | ±4.17 pp | -2.97 ppNot established |
| Hardee County | Florida | 756±181 | 18.3% | ±4.04 pp | -1.80 ppNot established |
| Calhoun County | Florida | 605±139 | 24.1% | ±4.88 pp | -4.35 ppNot established |
| Glades County | Florida | 577±124 | 17.7% | ±3.37 pp | -7.10 ppNot established |
| Hamilton County | Florida | 570±140 | 21.3% | ±4.74 pp | +2.42 ppNot established |
| Lafayette County | Florida | 547±145 | 31.3% | ±6.71 pp | +0.99 ppNot established |
| Union County | Florida | 501±125 | 19.2% | ±4.42 pp | +2.84 ppNot established |
| Liberty County | Florida | 239±82 | 22.0% | ±6.69 pp | +0.23 ppNot established |
A chart for local reporting
The chart shows ten highest point-estimate shares among Florida counties with at least 10,000 residents age 65+. That population cutoff is an editorial choice for readability, not an official Census threshold. All counties remain in the table and download above. Error bars indicate estimate uncertainty; the chart does not establish distinct ranks.
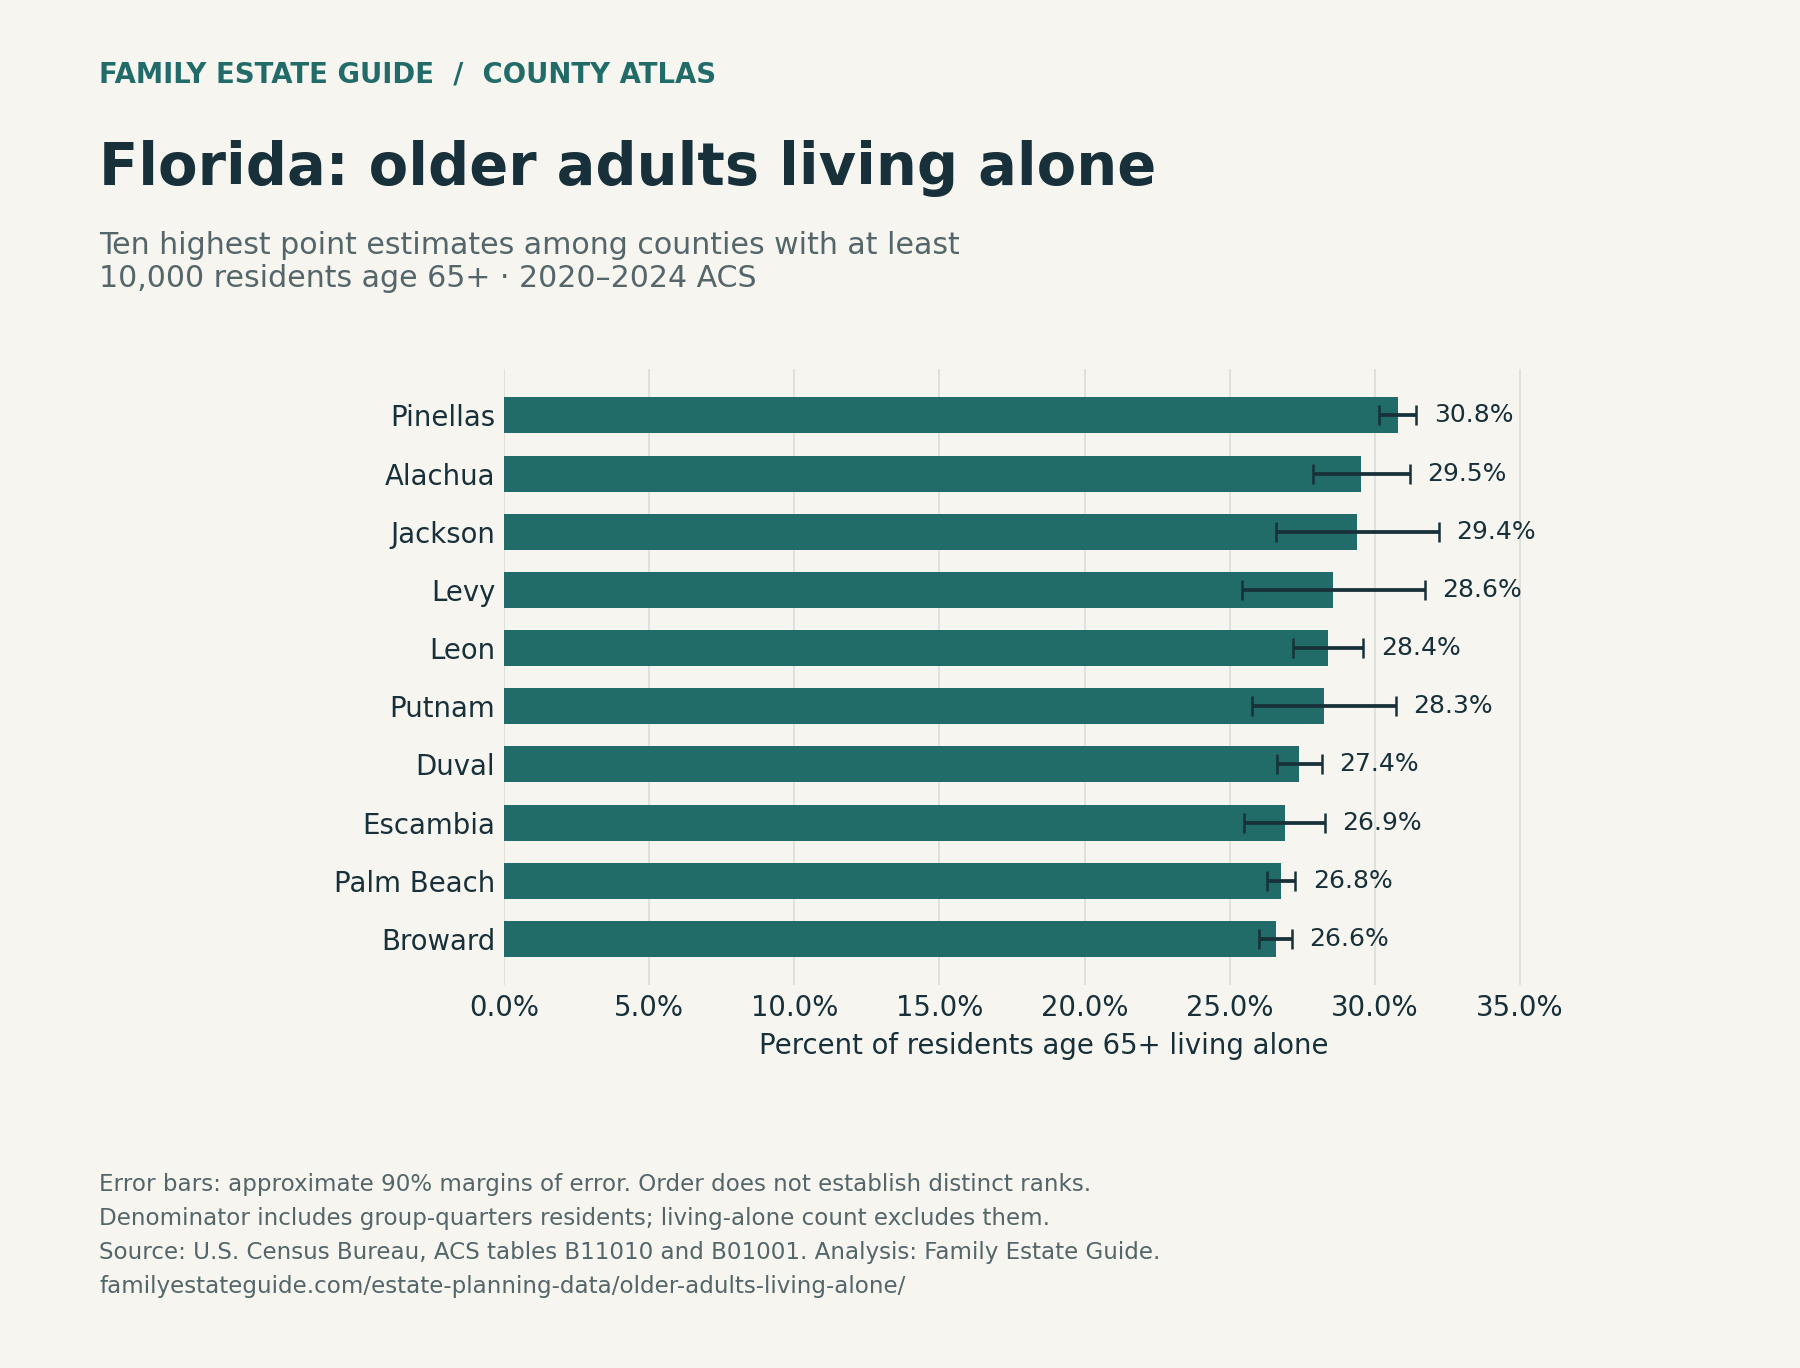
Download Florida chart (PNG) · Download charts, analysis and methodology (ZIP)
Questions for Florida reporters and organizations
For Florida reporting, contrast county-level scale and prevalence rather than treating the state as one uniform community. Pinellas, Palm Beach and Miami-Dade support different local questions. Marion’s period comparison offers a separate change story. Interviews about migration, household preference or access to services are complementary reporting, not causal conclusions supplied by these tables.
Ask which communities are represented by an estimate, whether services use the same geography, and which period the source describes. A county total is not a service-demand estimate. Living alone does not establish loneliness, a lack of family contact, incapacity or an absent estate plan. A survey percentage should not be used to diagnose a person.
Practical next steps for Florida families
The local data can start a conversation, but family preparation depends on actual circumstances. Confirm emergency contacts, where important records are kept, and who has agreed to help. Our Florida estate-planning guide organizes the state-specific questions.
- Florida will requirements and costs — understand what a will does and the signing questions.
- Florida living-trust costs — compare scope and expenses if you are evaluating a trust.
- Essential estate-planning documents — organize the financial and healthcare document conversation.
The atlas does not recommend buying a particular package because someone lives alone. Readers choosing a planning approach can compare a will and a trust; readers seeking local aging services can use the official Eldercare Locator.
Sources, definitions and reuse
Source: Census ACS five-year tables B11010 and B01001, 2020–2024 and 2015–2019. The numerator sums male/female householders age 65+ living alone, one person per household. It excludes group quarters. The denominator includes all older residents, including group quarters, so the measure answers what share of all older residents live alone.
Census publishes margins of error at a 90% confidence level; sums, proportions and differences use approximate Census formulas. Covariance is approximated, not calculated from variance replicates. National county-change labels use Benjamini–Hochberg at 10% false discovery rate across 3,133 comparable tests. See the national methodology and geography limitations or download complete calculation notes. Historical comparisons match identifiers; minor boundary changes are not harmonized.
Initial Florida community edition, September 17, 2026. Survey estimates are not 2026 headcounts. Editorial standards.