
Estate planning data & research
Compare CMS-certified nursing-home beds with older state populations. This nationwide reference adds a population benchmark to facility counts, with full state data and a transparent source trail.
Distinct certified facilities in the 50 states and DC
Known certified beds in the CMS snapshot
Certified beds per 1,000 residents age 75+
These are certified beds, not open beds, staffed beds, admissions offers or a measure of how many people need nursing-home care. Facilities serve residents of different ages, including rehabilitation patients. The older-population denominator is a comparison benchmark.
What the state comparisons show
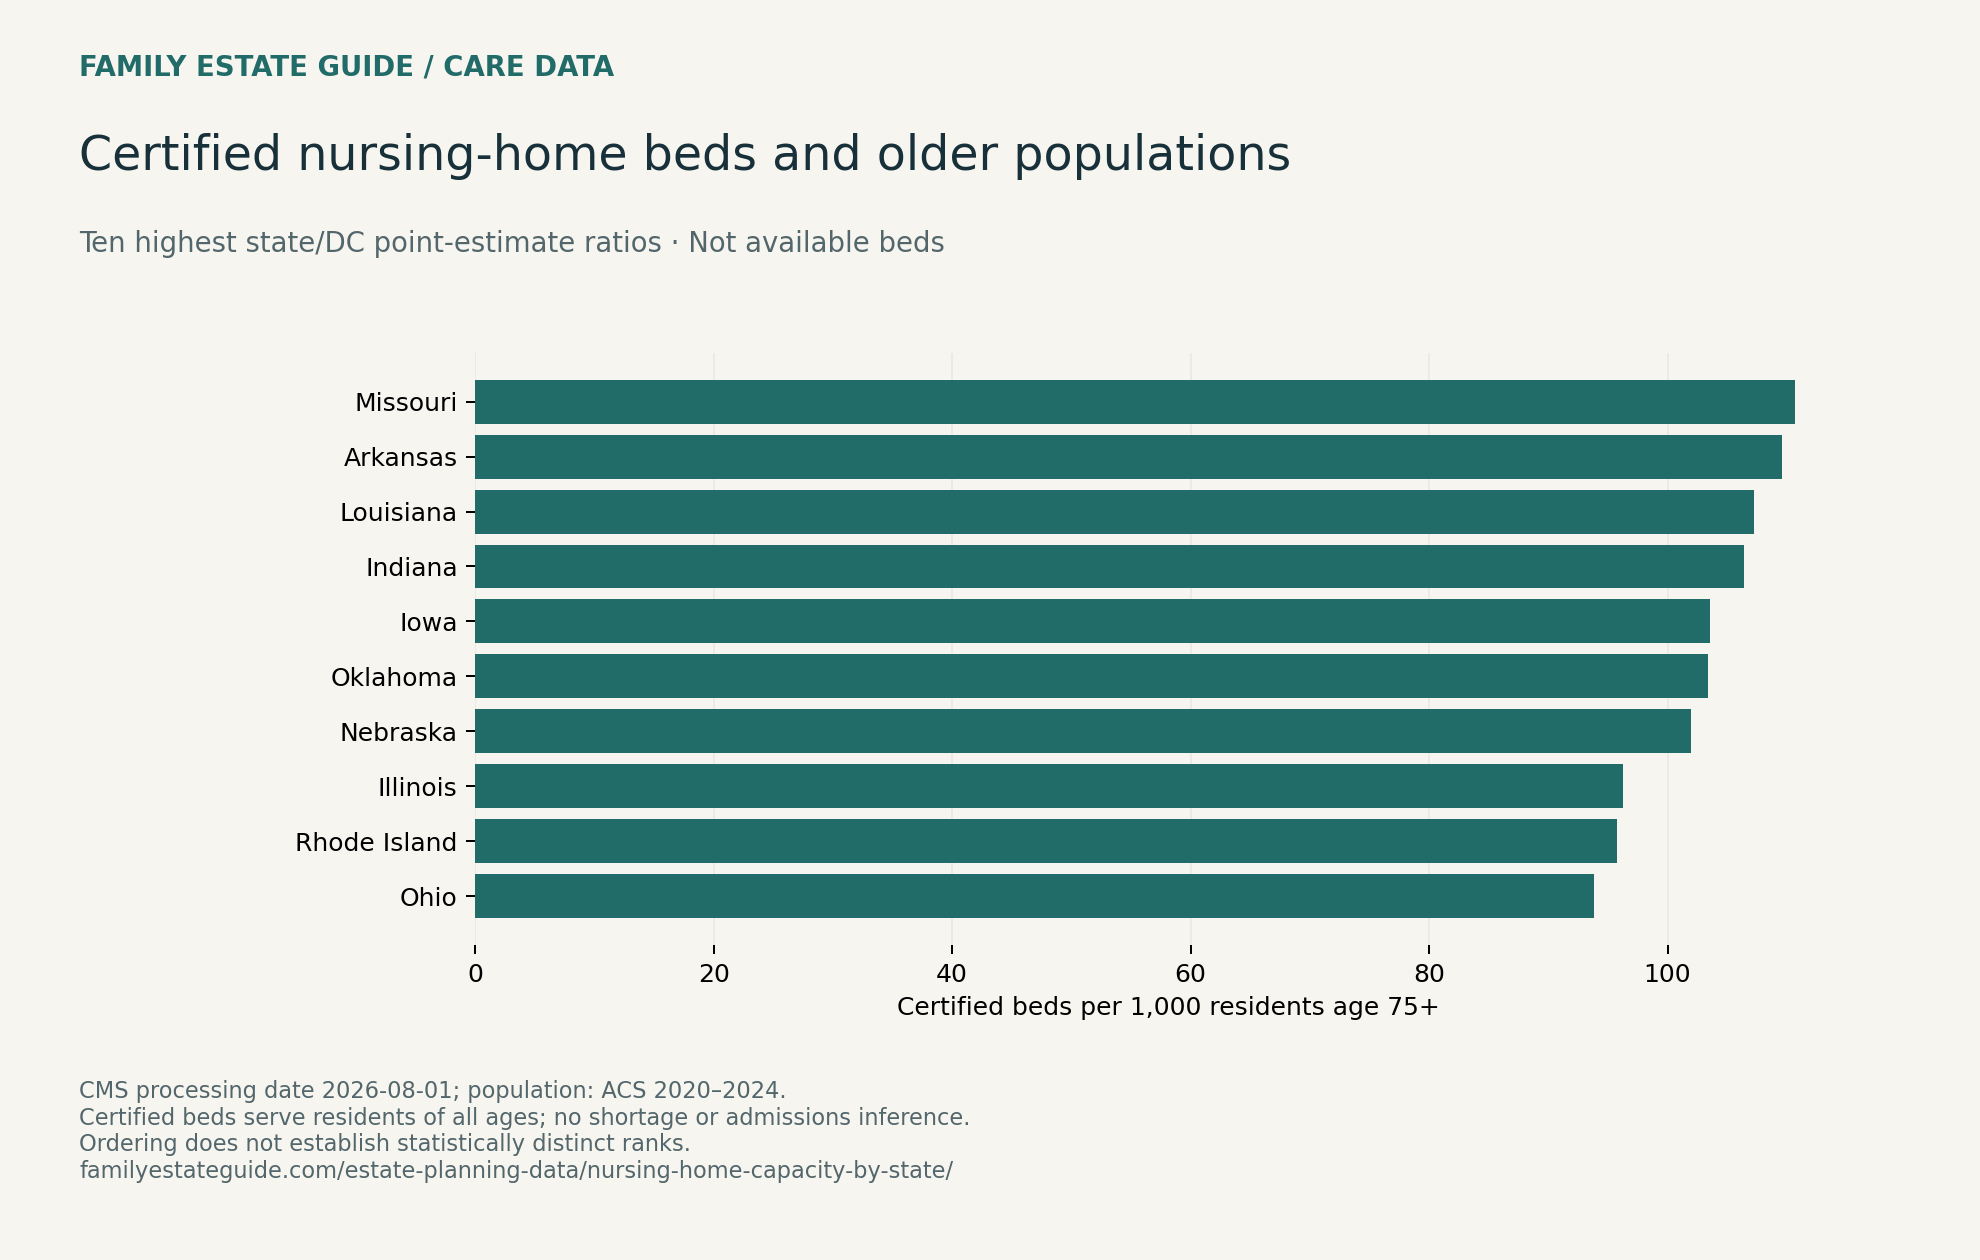
Missouri has the highest point-estimate bed-to-age-75+ ratio in this snapshot (110.7); Alaska has the lowest (24.1). Their difference does not prove a shortage, surplus or better care. Need, staffing, home/community services, geography and cross-border use are not measured by this ratio.
A large state can have many certified beds but a lower population-normalized ratio. A small state can have fewer beds and a higher ratio. The age-85+ column changes the population benchmark again; it does not imply that those beds are reserved for residents age 85+. Read counts and ratios together.
Explore every state
51 states and DC rows
| State | Facilities | Certified beds | Beds / 1,000 age 75+ | Beds / 1,000 age 85+ | 4–5 stars among rated facilities |
|---|---|---|---|---|---|
| Alabama | 224 | 26,504 | 73.2 | 302.5 | 38.6%1 unrated; 0 missing bed counts |
| Alaska | 20 | 815 | 24.1 | 118.9 | 45.0%0 unrated; 0 missing bed counts |
| Arizona | 140 | 15,984 | 26.6 | 111.5 | 43.2%1 unrated; 0 missing bed counts |
| Arkansas | 221 | 24,167 | 109.6 | 437.4 | 50.0%3 unrated; 0 missing bed counts |
| California | 1,165 | 114,991 | 45.1 | 154.5 | 43.5%11 unrated; 4 missing bed counts |
| Colorado | 210 | 19,757 | 56.6 | 212.4 | 41.6%1 unrated; 0 missing bed counts |
| Connecticut | 191 | 22,535 | 79.3 | 256.2 | 39.5%1 unrated; 0 missing bed counts |
| Delaware | 44 | 4,717 | 57.2 | 229.7 | 41.9%1 unrated; 0 missing bed counts |
| District of Columbia | 17 | 2,485 | 67.8 | 260.2 | 41.2%0 unrated; 0 missing bed counts |
| Florida | 694 | 84,537 | 39.3 | 147.6 | 48.6%3 unrated; 0 missing bed counts |
| Georgia | 356 | 39,494 | 62.1 | 254.6 | 29.0%1 unrated; 1 missing bed counts |
| Hawaii | 43 | 4,248 | 32.5 | 106.7 | 56.1%2 unrated; 1 missing bed counts |
| Idaho | 80 | 6,113 | 47.7 | 196.4 | 45.6%1 unrated; 0 missing bed counts |
| Illinois | 666 | 84,975 | 96.2 | 329.3 | 31.3%5 unrated; 0 missing bed counts |
| Indiana | 507 | 48,825 | 106.4 | 383.0 | 45.6%3 unrated; 0 missing bed counts |
| Iowa | 387 | 25,131 | 103.6 | 337.1 | 42.3%2 unrated; 0 missing bed counts |
| Kansas | 296 | 18,044 | 88.8 | 300.1 | 41.5%2 unrated; 0 missing bed counts |
| Kentucky | 267 | 25,368 | 82.3 | 336.0 | 41.9%2 unrated; 0 missing bed counts |
| Louisiana | 265 | 32,291 | 107.3 | 406.8 | 29.5%1 unrated; 0 missing bed counts |
| Maine | 78 | 5,830 | 47.0 | 185.2 | 39.0%1 unrated; 0 missing bed counts |
| Maryland | 221 | 27,307 | 64.7 | 231.4 | 42.5%2 unrated; 1 missing bed counts |
| Massachusetts | 341 | 40,961 | 78.9 | 268.7 | 42.9%3 unrated; 0 missing bed counts |
| Michigan | 422 | 44,005 | 59.2 | 211.2 | 42.4%2 unrated; 0 missing bed counts |
| Minnesota | 338 | 24,060 | 59.5 | 198.8 | 46.4%2 unrated; 0 missing bed counts |
| Mississippi | 202 | 17,496 | 87.4 | 357.1 | 32.7%3 unrated; 1 missing bed counts |
| Missouri | 487 | 50,043 | 110.7 | 402.1 | 27.3%8 unrated; 0 missing bed counts |
| Montana | 61 | 4,997 | 57.7 | 236.7 | 37.3%2 unrated; 2 missing bed counts |
| Nebraska | 180 | 13,715 | 102.0 | 344.8 | 34.3%2 unrated; 0 missing bed counts |
| Nevada | 66 | 7,235 | 34.0 | 151.6 | 49.2%1 unrated; 0 missing bed counts |
| New Hampshire | 73 | 7,326 | 66.4 | 259.4 | 47.2%1 unrated; 0 missing bed counts |
| New Jersey | 348 | 50,998 | 75.8 | 264.5 | 50.0%2 unrated; 0 missing bed counts |
| New Mexico | 68 | 6,880 | 41.7 | 160.2 | 32.8%1 unrated; 0 missing bed counts |
| New York | 593 | 111,413 | 74.2 | 250.1 | 40.0%3 unrated; 0 missing bed counts |
| North Carolina | 419 | 43,850 | 59.5 | 236.0 | 37.8%4 unrated; 0 missing bed counts |
| North Dakota | 72 | 4,909 | 89.7 | 283.9 | 45.1%1 unrated; 0 missing bed counts |
| Ohio | 922 | 81,083 | 93.8 | 331.5 | 43.5%10 unrated; 0 missing bed counts |
| Oklahoma | 283 | 27,595 | 103.4 | 421.3 | 32.0%2 unrated; 0 missing bed counts |
| Oregon | 128 | 10,602 | 32.8 | 121.3 | 45.7%1 unrated; 0 missing bed counts |
| Pennsylvania | 656 | 83,059 | 78.8 | 264.9 | 38.5%4 unrated; 0 missing bed counts |
| Rhode Island | 72 | 8,190 | 95.8 | 337.6 | 42.3%1 unrated; 0 missing bed counts |
| South Carolina | 187 | 19,589 | 49.8 | 208.5 | 40.3%1 unrated; 0 missing bed counts |
| South Dakota | 96 | 5,848 | 92.0 | 305.4 | 35.5%3 unrated; 0 missing bed counts |
| Tennessee | 303 | 34,613 | 72.6 | 302.3 | 39.0%3 unrated; 0 missing bed counts |
| Texas | 1,177 | 133,408 | 84.6 | 326.8 | 29.5%12 unrated; 0 missing bed counts |
| Utah | 97 | 8,379 | 53.8 | 213.3 | 44.8%1 unrated; 0 missing bed counts |
| Vermont | 33 | 2,951 | 53.9 | 211.2 | 40.6%1 unrated; 0 missing bed counts |
| Virginia | 289 | 32,648 | 55.1 | 218.0 | 39.2%3 unrated; 0 missing bed counts |
| Washington | 193 | 18,781 | 36.8 | 135.6 | 46.1%2 unrated; 0 missing bed counts |
| West Virginia | 123 | 10,717 | 71.3 | 291.9 | 40.2%1 unrated; 0 missing bed counts |
| Wisconsin | 323 | 24,758 | 57.0 | 198.9 | 38.0%2 unrated; 0 missing bed counts |
| Wyoming | 36 | 2,938 | 72.1 | 288.2 | 34.3%1 unrated; 0 missing bed counts |
Why the star column has a separate denominator
The four/five-star percentage is the share of rated facilities with an overall rating of four or five. Unrated facilities are reported separately rather than assigned zero stars. Each facility counts equally; this is not the percentage of beds in highly rated facilities. CMS’s overall rating combines inspection, staffing and quality information; the summary cannot tell you which facility fits an individual’s clinical needs.
Use Medicare Care Compare for individual providers and read CMS’s explanation of the Five-Star system. A state average is not a recommendation to choose a particular home.
A reusable chart
The chart shows the ten highest descriptive ratios. It is not a league table of available care or statistically distinct ranks.
Questions families and local reporters can ask
- How many certified beds are staffed and accepting new residents? That requires current provider information.
- Do facilities accept the payment arrangement the family will use? Certification alone does not answer that.
- What home-based or community options are relevant to the person’s needs?
- Are nearby facilities across a county or state line practical to reach?
For prices and quality context, see our nursing-home costs and quality reference. Use the care-cost and older-household-income comparison to examine a quoted bill against a clearly stated income benchmark.
Connect the research to family preparation
Care decisions and legal preparation are related conversations, but the bed ratio cannot determine which documents someone needs. Start with the aging-parent roadmap and essential estate documents. Keep healthcare authority, emergency contacts and access to records clear. For local support, use the official Eldercare Locator.
Sources, methodology and reuse
Where do these figures come from?
CMS Provider Information describes active certified facilities. Processing date: 2026-08-01; source retrieved September 17, 2026. Population and household income use Census ACS 2020–2024 five-year estimates, including all 50 states and DC. Territories are excluded. These source periods differ; this is not a same-day census.
ACS B01001 age estimates · ACS B19049 household income · Census income definitions.
Calculations, missing values and estimate uncertainty
Providers are deduplicated by CMS Certification Number. Known certified beds are summed by state; missing counts are reported separately. Beds per 1,000 divide known beds by the stated age-group estimate and multiply by 1,000. Those certified beds serve all ages; the denominator is a comparison benchmark, not an allocation of beds to older residents. Facility star percentages use rated facilities only and give each facility equal weight.
The income median is for households with a householder age 65+, before taxes, in 2024-adjusted dollars. It is not disposable income, personal retirement income or wealth. The ± value shows sampling uncertainty at Census’s standard 90% confidence level. Wider intervals mean less precise estimates. No statistically distinct state ranking or individual affordability conclusion is established.
Complete formulas, variable definitions and limitations (TXT).
Download all 51 state/DC rows (CSV) · Analysis, charts, SVGs and methodology (ZIP)
Published September 17, 2026. Editorial standards.